
In talking to Online EU Training users, one of the main requests we hear is for explanations for numerical reasoning tests to be much more detailed. We are here to report that we are already working on this!
Our current explanations, while containing all the essential information to be able to answer the test questions correctly, are quite short - usually 3 or 4 sentences in a single paragraph.
Let's see an example!
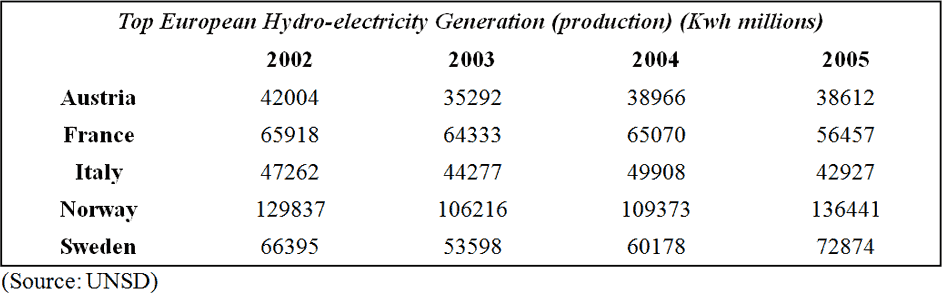
Question: Using the data in the table below, assume Norway's population declines constantly by 32000 per year to 4635000 in 2005. What is the percentage change in per capita production from 2002 to 2004?
A. -11.1%
B. 2.3%
C. -6.2%
D. -14.6%
E. It stays the same
Current Numerical Reasoning Explanations
Our current explanation for this test question can be read below.
--------------------------------------------------------
The per capita generation is the total generated divided by the population. The total generated in 2002 is 129837mKwh and the population is (4635000+(3*32000))=4.731m. The per capita generation is 129837/4.731Kwh=27444kwh/person. In 2004 the total generated falls to 109373mKwh and the population falls by 64000 to 4.667m giving a per capita generation of 23435. The change is 100*(27444-23435)/27444=-14.6%.
-------------------------------------------------------
New Numerical Reasoning Explanations
In the new format we are working on and phasing in gradually, the explanation for this test will look like this.
-------------------------------------------------------
Data Interpretation
From the table provided, we will need to use data regarding Norway for 2002 and 2004. Also, we will need the data from the question text itself regarding the population of 2005 and the amount it has decreased in order to calculate the total populations in Norway for 2002 and 2004. All other data is superfluous.
Reasoning
We will need to calculate the total populations for both 2002 and 2004. We will then use these figures to calculate the energy generated per capita in these years by dividing the total electricity generated that year (which can be found in the table) by the total population for that year. Finally we need to calculate the percentage change per capita between 2002 and 2004. We will do this by subtracting the 2004 percentage from the 2002 percentage then dividing this difference by the 2002 total. This is because we need to identify the difference as a proportion of the 2002 total. We will then multiply this by 100 to convert it into a percentage of the 2002 total.
Calculation
To find the total Norwegian population in 2002 we take the total population in 2005, provided in the question text, which is 4,635,000 and add 32,000 for each year between 2002 and 2005 as the question states this is how much the population decreased by each year.
So there are 3 years between 2002 and 2005 which means we need to add 3 lots of 32,000 to the 2005 population:
3 x 32,000 = 96,000
96,000 + 4,635,000 = 4,731,000 = 4.731m
We can now repeat this process but for 2004 instead. So there is 1 year between 2004 and 2005 meaning we will add 1 lot of 32,000 to the 2005 population:
1 x 32,000 = 32,000
32,000 + 4,635,000 = 4,667,000 = 4.667m
The second stage of our calculations includes calculating the energy generated per capita for both 2002 and 2004. This can be found by taking the electricity generated (Kwh millions) from the table and dividing by the total population for each year.
For 2002:
129,837mKwh / 4.731m = 27444Kwh/person
For 2004:
109,373mKwh / 4.667m = 23435Kwh/person
Now in the third stage of our calculations we need to find the percentage change. To find the difference we subtract the 2002 per capita figure from the 2004 per capita figure:
23435 – 27444 = -4009
We then need to identify this value as a proportion of the original 2002 per capita generation:
-4009 / 27444 = -0.1461
Then to convert this into a percentage we multiply by 100:
-0.1461 x 100 = -14.61%
The possible answers provided are only given to 0.1% making the correct answer D -14.6%.
Potential Shortcuts / Pitfalls
The question is quite difficult in that it requires a three stage calculation within the exam time limit. This means we need to work quickly and identify our relevant components quickly. Whilst doing this it is important to make sure we are aware of the units of measurement being used both in the question and the table and that any conversion of units, such as population into millions (4,731,000 = 4.731m), is applied to both sets of data.
Rounding is another potential pitfall when working quickly. In a question such as this it is important to keep decimal places in mind until presenting the final answer.
Lastly, it is important to acknowledge that the population has decreased each year up to the given total population of 2005. Therefore to calculate the total population of previous years we need to increase by 32,000 each year to regain the total populations for 2002 and 2004.
-----------------------------------------------------------------
Hope you like the new format! :)