
Recently we have received many requests from EU Training’s users asking for expert tips or methodology on how to quickly solve the various test types, such as abstract, numerical or verbal reasoning.
While the best way to learn about the methodology of succeeding at these tests is via the live and recorded training webinars, we hereby show you the next part in our series on EU test methodology.
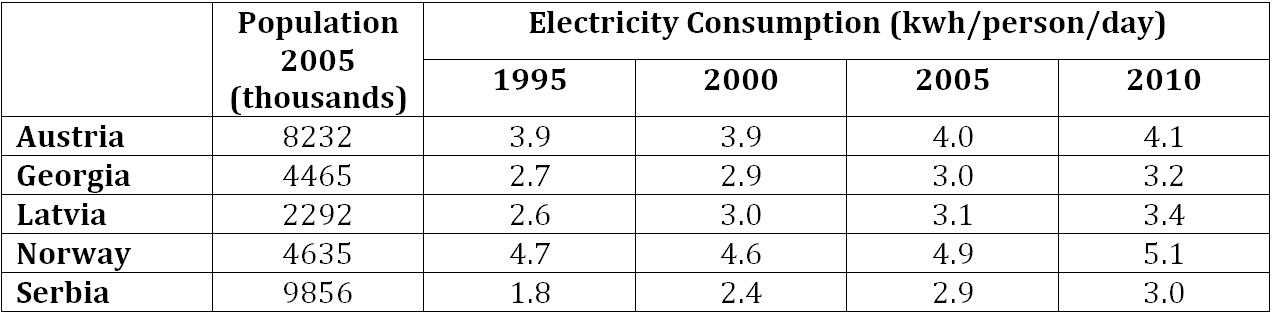
Numerical reasoning sample
When it comes to numerical reasoning, there are a myriad things to watch out for and consider when taking the test. For this article, we are going to concentreate on two things:
• how to avoid spending time on calculating values you won’t actually use
• how not to fall for the traps set by the test designer
Let’s consider the following question based on the table above.
If the table were ordered by percentage increase in per capita usage between 2005 and 2010, which country would be in the middle?
1. Your first task: data interpretatation
Extract the information you need from the table. Your first instinct may tell you the following:
„The question is about per capital figures, so obviously we will need the population figures for both 2005 and 2010.”
If you re-read the question and the table headers, you will, however, realise that this is not the case. The electricity consumption values given for the four years are already given per person, so there is no need for the population figure to be used. We couldn’t even rely on it, because the populations are only provided for 2005.
2. Your second task: quick calculation
„We now need to calculate the increases in the per person consumption figures between 2005 and 2010 for all 5 countries.”
This is certainly a valid way to continue. But let us take the extra second and consider whether it is necessary. Remember, the question does not ask about the actual increase percentages, only about which country would be in the middle if the countries were ordered by this criterion.
By simply looking at the figures, we can determine, without calculation, that:
• Latvia will clearly be at the top, as its increase was largest when compared to the base value (.3 on 3.1 kWh)
• Austria and Serbia will clearly be at the bottom (we can’t know the exact order without a calculator, but we don’t need this information) because their increase was the smallest (.1 on 4 and 2.9 kWh respectively)
This means that we are left with Georgia and Norway to consider, and we are looking for the country with the smaller increase of these two, as that is the one that will be in the middle.
Again, we could perform the actual calculations and compare the two numbers, or we can re-inspect the numbers and notice, again, something interesting.
3. First impressions may mislead you
The per person increase in both countries was 0.2 kWh, so at first glance it would be very hard to decide between the two. But let’s realise that the smaller increase, then, will be the one that happened over the strongest basis. Why?
Consider this related example:
Both companies A and B increased their profits by 10,000 EUR.
Company A increased it from 10,000 EUR to 20,000 EUR.
Company B increased it from 100,000 EUR to 110,000 EUR.
Expressed as percentage increase in profits, Company A clearly fared better as its profit increased by 100% (it doubled) while Company A only manged a meager 10% increase.
By analagy, we can conclude that the smaller percentage increase must have happened in Norway by virtue of the fact that the same 0.2 kWh increase took place over 4.9 kWh, as opposed to 3.0 kWn in the case of Geargia.
The correct answer, then, would be Norway.
4. Conclusions & tips
• always take a few seconds to clearly determine exactly which parts of the table you will absolutely need to use (just because the questions talks about per capita figures, you don’t necessarily need to use the population numbers)
• related to the above, always read the table headers (this is how we know we were already given the per person figures)
• always make sure that you don’t perform superfluous calculations (remember how we excluded Austria, Serbia and Latvia without performing actual calculations)
Interested in learning more?
Check our FREE Beginners Guide and Pro Tips Webinar on Numerical Reasoning